

How to Read Japanese Candlestick Patterns
Before we get into the list, I've picked up a few tips and nuances that I've picked up over the years that should be discussed. I've found candlesticks to be one of the most powerful tools in predicting future price movements. What I've learned is that it needs to be cut and dry. For example, it's rare to see a bullish reversal candlestick pattern formed on a daily stock chart followed by the stock bouncing hard. It's rarely that picture-perfect.
The timeframe is key when trying to predict future price movement. Over the years, I've found that bullish candlestick patterns formed on the monthly or weekly chart are much more meaningful than those formed on the daily or 60-minute chart.
Often, daily, you will see a nice bullish candlestick pattern, followed by a few red days, followed by a few more bullish candlestick patterns, and then the price finally takes off. The point here is, there isn't always a perfect setup. The price either undershoots or overshoots theoretical bounce targets, and it takes more time than one would expect for the price to change direction. This is why reading charts is an art form.
When reading charts and trying to create a profitable trade setup, you ALWAYS want to see a cluster of signals. For example, if you see a candlestick reversal pattern, you would want this to occur on the lower Bollinger Band, and on an important moving average (let's say the 50 SMA). When you have 3 signals telling you there is a reversal, the signal is much stronger. Just like in poker, you want a "cluster of tells", the same goes for chart reading.
Again, technicals alone are not always enough; you need to understand upcoming catalysts (such as earnings or product launch) as well as whether earnings are near (earnings always trump technical analysis).
Now with these tips out of the was,y let's get to my top 5 most useful ones!
1 Three White Soldiers

Three White Soldiers is a bullish candlestick pattern that takes place over three days. You will observe long candles that are white or green in color and have small wicks. The important thing to observe is that candles open and close higher than the previous day. This kind of bullish candlestick pattern is usually seen after a strong downward trend and also indicates the potential direction of the share prices in the next few days. I often like to see those near the lower Bollinger Band, as that also provides a bit of a boost to lift up the price.
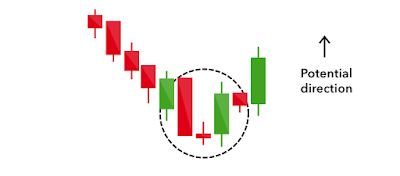
This bullish candlestick pattern instills a ray of hope in the minds of investors in an otherwise gloomy market. In this pattern, a short candle is seen between two long green and red candles. It tells the investor that the selling pressure of the market is slowly ending, and they can expect a bullish market at the end of the tunnel. The potential direction of the market in this candlestick pattern is upward. I often see these with major bullish news events, whether it be stock-related news or global events lifting the stress of the market. This bullish candlestick pattern is formed with just two candlesticks, with a long red candle followed by a long green candle. You will find that there is a good difference between the closing price of the red candlestick and the opening price of the green candlestick. Such a pattern indicates buying pressure as the price goes up to the mid-range of the previous day's closing price or even higher. The piercing line candlestick pattern indicates a reversal after a slight downtrend. The Piercing Line is not as reliable as other patterns I've found but they are often seen when the price starts to bottom out. So don't expect a quick reversal.

Hammer is one of the most popular bullish candlestick patterns. In this pattern, the candle is short with a long lower wick. Such a pattern is usually observed at the end of a long downward trend in the stock market. The hammer indicates an upward trend in the market after a period of selling pressure that brings prices down. The color of the short hammer can be red or green, but in general, the market is more bullish if it is green in color.
This is my favorite, nothing like it forming on a major moving average which coincides with the lower Bollinger band (again remember a cluster of signals confirming a direction), If you look at the havoc that COVID did to many stock charts you will see at the bottom, a ton of hammers formed across multiple stocks and indexes!

This is a candlestick pattern formed by two candles, one of which is red and the other is green. The first candle is red, which is short, and it is seen completely engulfed by the 2nd green candle. The large green day is often formed with a "gap down" (which usually means exhausted selling pressure). So always keep in mind what potential candle can be formed in real-time, so you can capture the entire move (i.e., look for those gap downs as a buying opportunity,y especially when things start to get very oversold)
These slight nuances and deviations from theory to practice are what make trading stocks equal parts art and technicals.
To learn more about candlesticks, check out our article on Mastering Japanese Candlestick Reading.
Also, credit to IG for providing the images above for candlesticks.
2 Morning Star

3 Piercing Line

4 Hammer

5 Bullish Engulfing

This is a candlestick pattern formed by two candles, one of which is red and the other is green. The first candle is red, which is short, and it is seen completely engulfed by the 2nd green candle. The large green day is often formed with a "gap down" (which usually means exhausted selling pressure). So always keep in mind what potential candle can be formed in real-time, so you can capture the entire move (i.e., look for those gap downs as a buying opportunity,y especially when things start to get very oversold)
Conclusion
When looking for bullish candlestick patterns, remember that not everything is cut and dry; you won't instantly see a reversal once you see these out in the wild. Also, keep in mind, if these patterns are formed near the lower Bollinger Band or around a significant moving average, this will yield a more powerful confirmation.These slight nuances and deviations from theory to practice are what make trading stocks equal parts art and technicals.
To learn more about candlesticks, check out our article on Mastering Japanese Candlestick Reading.
Also, credit to IG for providing the images above for candlesticks.