Expert traders quickly tell you that combining two indicators will inevitably give you better and more reliable signals on when to enter or exit an open position. Moving Average Convergence Divergence (MACD) is a trend-following momentum indicator that shows the relationship in the movement of the price of a security. It combines two indicators: a 12-day exponential moving average for the short-term changes and a 26-day exponential moving average for the long-term changes.
Gerald Appel invented the MACD in the 1970s. He intended to create an indicator to reveal a stock's trend direction, momentum, strength, and length. This makes it unique from other indicators, as it's an "all-in-one" indicator.
Gerald Appel invented the MACD in the 1970s. He intended to create an indicator to reveal a stock's trend direction, momentum, strength, and length. This makes it unique from other indicators, as it's an "all-in-one" indicator.
The MACD Formula
MACD is calculated by taking the 26-period exponential moving average (EMA) and then subtracting the 12-period EMA. This gives the MACD a 9-day EMA, the signal line.When the 12-period EMA exceeds the 26-period EMA, the MACD will be positive. It will be negative when the 12-period EMA is below the 26-period EMA. When the MACD and baseline distance increase, it indicates a growing distance between the two EMAs.
MACD = 12-period EMA – 26-period EMA
Signal Line = 9-day EMA of MACD
Histogram = MACD Line - Signal Line
Histogram = MACD Line - Signal Line
The chart below breaks down the three aspects of the MACD indicator.

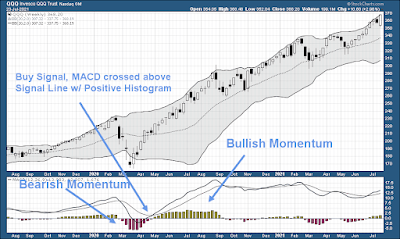
When the MACD crosses above its signal line, this indicates that a trader is in a position to buy the security, while when the MACD crosses below its signal line, it’s an indication to sell or short the security (selling short is not advised, beware).
MACD's data can be represented with a histogram, which maps the distance between the MACD and its signal line. When the MACD is above the signal line, the histogram will be above the MACD's baseline, and vice versa. The MACD histograms are used by traders to identify when the bullish and bearish momentum is high.
MACD Indicator Interpretations
The MACD is designed to focus on the convergence and divergence of its two moving averages.
Where divergence happens when the moving averages go in opposite directions, while Convergence occurs when the moving averages move closer to each other. This is the foundation of how buy and sell signals are generated using the MACD Indicator.
Below are a few easy-to-understand signals generated by the MACD. Keep in mind this is a basic interpretation and as you practice and continue to read more material, you can have much more advanced readings, which will reduce false signals.
- When the MACD line crosses above zero, it indicates a bullish trend, while a bearish trend will be indicated by the MACD crossing below zero.
- When the MACD line crosses the baseline back and forth, MACD traders will avoid the market to deal with minimal portfolio volatility. If you see this you should really stay away from buying options, as it shows no clear trend.
- A stronger signal is indicated when the divergence between the MACD and the price action is in line with the crossover signals.
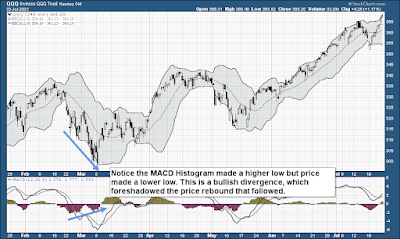
When the momentum of a security price is waning, a divergence indicator is meant to correctly show that a reversal is imminent. When an indicator makes lower highs while the price is higher, this is called a Bearish Divergence. When the price makes lower lows and the indicator makes higher lows, this is called a Bullish Divergence. Divergence is one of the most powerful aspects of this indicator.
You can measure divergence via the histogram as well as the signal line. You can even draw support and resistance lines on this indicator (they may even be more meaningful than drawing it on pure price charts).
You can measure divergence via the histogram as well as the signal line. You can even draw support and resistance lines on this indicator (they may even be more meaningful than drawing it on pure price charts).
Look at the example below, which shows a bullish reversal using divergence. The histogram never made a lower low in this example, but the price did. Eventually, the MACD's bullish divergence signals correctly foreshadowed price-making new highs shortly after. I added a horizontal line at 0, to indicate when Bulls and Bears are in control (just a bit more pleasing to the eye).
Conclusion
The MACD indicator is commonly used by traders to detect when the current momentum in a stock’s price may indicate a change in its underlying trend. It is also important to note that since the indicator uses historical data, it can be referred to as a lagging indicator and will reverse course after a price action change has occurred. Therefore, it's important to note this severe limitation and possibly use other indicators/signals to exit your position. Although it was meant to be a multi-use indicator with several different parts, I think it really falls short on its own but can be used in conjunction with other indicators to develop a more concrete trading system, where it will allow you to ignore a lot of the false signals the MACD indicator tends to generate.It's best to use the MACD as a trend-riding signal, where you want to capture a strong trend briefly. Remember, it's not good to let you know when it's time to exit unless you interpret histogram shrinking as an exit entry (basically as the histogram Y-axis shrinks).
One of the best ways to create a trading system is to scan the market daily, where you find stocks with their MACD line above the signal line (bullish buy signal). You can further backtest this strategy and continually add further refinements until you have something close to beating the buy-and-hold strategy. This is a great starting point for creating a trading system. For those looking for a world-class scanner and backtesting tool, sign up for TrendSpider, and use the links provided here for up to 40% off. Make sure to check out the "enhanced" package, which offers weekly one-on-one sessions!


