

How Do You Create a Winning Trading System? (Quick Answer)
A “winning” trading system is a repeatable set of entry + exit rules with risk management, validated by
backtesting and kept honest with out-of-sample testing. The workflow is:
- Define a simple rule set (entry, exit, risk)
- Backtest on broad markets (SPY/QQQ) and multiple regimes
- Evaluate stats (returns, drawdown, win rate, avg trade, exposure)
- Iterate carefully (avoid overfitting)
- Paper trade → small size → scale only after real results
“If you give a man a fish, you feed him for a day. If you teach a man to fish, you feed him for a lifetime.”
That quote maps perfectly to trading. Most traders don’t have a system—so they end up relying on: subscriptions, alert services, and social media “experts” (which is usually a fast track to losses).
A trading system doesn’t have to be perfect on day one. In fact, most systems start mediocre. The point is to build something you can measure, iterate, and improve over time. Once you have a real process, you stop guessing—and you stop outsourcing your decisions.
Related (important): Stop Trading Options
Backtesting Tools (What I Use)
To build a system, you need a backtester. This article uses
TrendSpider’s strategy tester / backtesting tools
(exclusive discount code).
If you’re serious about system-building, prioritize tools that let you:
If you’re serious about system-building, prioritize tools that let you:
- Backtest rules across multiple symbols (SPY, QQQ, major stocks)
- View trade-by-trade results + metrics (drawdown, exposure, avg trade)
- Iterate quickly without “coding everything from scratch”
Step-by-Step: How to Backtest a Stock Trading System
Here’s the exact framework I recommend for building your first “real” system:
-
Pick a market + timeframe.
Start with daily candles for swing trading. (Day traders can test hourly/15-min later, but daily is easier to validate.) -
Pick a baseline benchmark.
Your system must be compared to buy & hold on the same symbol. If you can’t beat buy & hold after realistic frictions, you need a reason to trade it. -
Define entry + exit rules.
You need both. A strategy without a clean exit rule is not a system—it’s a hope. -
Test across regimes.
Don’t only test bull markets. Your system should be survivable in chop and drawdowns. -
Iterate one variable at a time.
If you change five things at once and results improve, you won’t know why.
Below is the TrendSpider layout used for this tutorial:
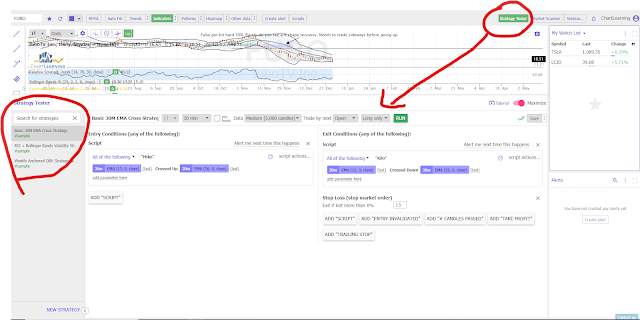
A Simple Starter System (5/10 EMA Crossover)
We’ll start with a basic momentum framework:
You can build and test this using the TrendSpider strategy tester (exclusive discount code).
- Buy when the 5 EMA crosses above the 10 EMA
- Sell when the 5 EMA crosses below the 10 EMA
You can build and test this using the TrendSpider strategy tester (exclusive discount code).

Important: this is a “starter system” to demonstrate the process. Most simple crossovers
do not beat buy & hold over long periods on major indices—testing will prove that quickly.
How to Evaluate a Backtest (What Actually Matters)
Don’t fall for a backtest that looks good but has hidden problems. These are the metrics you should care about:
Also: always assume slippage and imperfect fills. If your average trade is tiny (e.g., <1%), real-world friction can erase it.
- Total return vs buy & hold (the baseline)
- Max drawdown (how deep it can go underwater)
- Exposure (how often you’re in the market)
- Average trade and median trade (is edge consistent or one lucky period?)
- Number of trades (more trades = more realistic sample size)
- Whipsaw / chop sensitivity (crossovers often get destroyed here)
Also: always assume slippage and imperfect fills. If your average trade is tiny (e.g., <1%), real-world friction can erase it.
Example results screenshot:

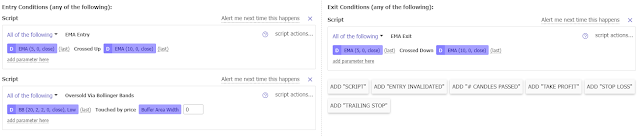
Iterating: Improving the System With a Second Signal
One common improvement approach is using a cluster of signals (two independent reasons to enter).
For example: keep the EMA crossover, but add a second entry based on volatility extremes.
Here’s a simple add-on: Bollinger Bands.
Bollinger Bands guide: What Are Bollinger Bands?
- Entry #1: 5 EMA crosses above 10 EMA
- Entry #2: price touches the lower Bollinger Band
- Exit: 5 EMA crosses below 10 EMA (starter exit rule)
Bollinger Bands guide: What Are Bollinger Bands?
If your results get closer to buy & hold, you’re moving in the right direction.
The point isn’t that this exact combo is “the answer”—it’s that iterative improvement is how edge is built.

Common Backtesting Mistakes (That Ruin Results)
These are the traps that cause “great” backtests to fail live:
- Overfitting: adding rules until the past looks perfect (then the future collapses)
- Testing only one symbol: your system might just be “optimized for that stock”
- Ignoring drawdown: high returns are meaningless if you can’t survive the dips
- Too few trades: a strategy with 12 trades in 10 years is not validated
- No realism: slippage, spreads, and imperfect fills can erase small edges
FAQ
What symbols should I test first?
Start with SPY and QQQ (broad indices), then test major liquid stocks across different “personalities”
(AAPL, AMZN, MSFT, TSLA, etc.). Your goal is to see if the idea survives different regimes—not just one lucky chart.
How much history should I use?
Longer is generally better as long as the data includes multiple environments (bull, bear, sideways).
But also test more recent periods so you don’t build something that only worked in the past.
Can you beat buy & hold?
It’s hard. The easiest “win” is sometimes not higher returns, but lower drawdown with similar returns
(better risk-adjusted performance). The market has a built-in upward drift—your system must earn its keep.
Conclusion
A trading system is how you stop guessing. Backtesting forces brutal honesty:
either your rules produce an edge, or they don’t.
If you want to build a real system, your job is simple (not easy): test ideas, measure results, iterate slowly, avoid overfitting, and validate in real time with small size.
If you want to build a real system, your job is simple (not easy): test ideas, measure results, iterate slowly, avoid overfitting, and validate in real time with small size.
Next step: read How To Create A Trading Edge.
Backtesting tool used in this tutorial:
TrendSpider (exclusive discount code).