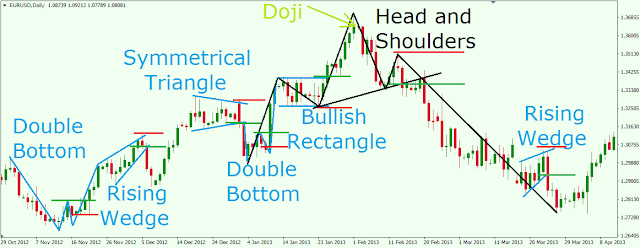
Chart patterns can provide a rare clarity signal in the daily noise of market price action. And no matter what security or asset class you’re trading, chart patterns can help you make sense of the numbers and interpret random information into actionable insights. In my experience, this is especially true for trend followers and other traders with price action at the heart of their trading strategy.
I wanted to write this short article to share exactly how I use different reversal and continuation chart patterns to orient myself in any market environment. So by the time you’re done reading, hopefully, you’ll have a much deeper understanding of how chart patterns can be one more valuable resource in your technical analysis toolbox. So where do we start?
But the problem with this approach is it can be hard to know when a trend is too extended or might have further to run. And that’s exactly where chart patterns can help shine a light! Let me show you what I mean.
On the contrary, though, chart patterns can also help alert you to high probabilities of continued follow-through. So, for example, I often scan for stocks hitting new 52-week highs. But it can sometimes be scary to buy these stocks when they appear they’ve gone up too far, too fast. However, if there is a clear chart pattern in recent history, I often feel more confident taking a swing.
For instance, I’m much more comfortable buying a technical breakout in an uptrend if it has also recently broken out of a multi-week ascending triangle pattern because the projected measured move provides some forward-looking reassurance that this stock might have more gas in the tank.
I wanted to write this short article to share exactly how I use different reversal and continuation chart patterns to orient myself in any market environment. So by the time you’re done reading, hopefully, you’ll have a much deeper understanding of how chart patterns can be one more valuable resource in your technical analysis toolbox. So where do we start?
How Chart Patterns Help Trade:
As a trend-following trader, my main trading and investing strategy is to buy stocks going up in price and try to hold on for the ride. This momentum-driven approach works well in bull markets and keeps me out of trouble during flat or bear markets.But the problem with this approach is it can be hard to know when a trend is too extended or might have further to run. And that’s exactly where chart patterns can help shine a light! Let me show you what I mean.
Using Stock Chart Patterns:
For starters, chart patterns can really help you manage your expectations. As you probably know, in trading, staying grounded in reality is key to a consistent P&L. So when you see a stock hit a new high, only to fall back into a long, sideways consolidation pattern, you can accept this pattern and adjust your expectations to the reality that you may not see capital gains right away. You might even decide to sell your stock and move on, depending on your timeframe.On the contrary, though, chart patterns can also help alert you to high probabilities of continued follow-through. So, for example, I often scan for stocks hitting new 52-week highs. But it can sometimes be scary to buy these stocks when they appear they’ve gone up too far, too fast. However, if there is a clear chart pattern in recent history, I often feel more confident taking a swing.
For instance, I’m much more comfortable buying a technical breakout in an uptrend if it has also recently broken out of a multi-week ascending triangle pattern because the projected measured move provides some forward-looking reassurance that this stock might have more gas in the tank.
Reversal Chart Patterns
The contextual information chart patterns provide is especially true with reversal patterns. When combined with the signs of a new uptrend, a clearly identifiable multi-week or multi-month reversal pattern (like a big double-bottom or head-and-shoulders top) can give me the conviction to bet big on an entry signal. In fact, some of my biggest wins over the last couple of years have benefited directly from incorporating reversal chart patterns like this.
Bottom line? By adding chart pattern analysis to your existing trading or investing toolset, you can get an important context to help you manage your expectations for a given trade (both to the upside and the downside!)
For me, by focusing on longer-term chart patterns, I can better manage my mental and emotional expectations of a given trade. And I can adapt my trend-following trading strategy to bet bigger or smaller depending on confirmation from reversal or continuation patterns on the charts.
So that’s why chart pattern trading has been a big win for me personally, and I suspect if you can add it to your decision-making tools, you’ll be better off too!

