

EMA Cloud Indicator (Quick Answer)
The EMA Cloud is a trend-following indicator (popularized by
Ripster)
that plots two exponential moving averages (EMAs) and shades the area between them.
Traders use the cloud to quickly see trend direction and likely support/resistance zones during pullbacks.
TL;DR
- Green cloud (fast EMA above slow EMA) = bullish bias
- Red cloud (fast EMA below slow EMA) = bearish bias
- Best in trending markets; can whipsaw in sideways chop
- Common settings: 5–12, 8–9, 20–22, 34–50
Jump to:
How to use ·
Best settings ·
Step-by-step ·
Backtesting (TrendSpider) ·
Examples ·
FAQ ·
Conclusion
Most traders use the same public indicators in the same obvious ways—so they end up with the same results.
Real edge comes from
thinking outside the box,
testing variations, and building a repeatable process. The EMA Cloud is a “simple-but-useful” twist on traditional EMAs
that makes trend and pullback zones much easier to see at a glance.

How to Use the EMA Cloud Indicator
EMA Clouds are built from two EMAs. When the faster EMA is above the slower EMA, the shaded area becomes a
bullish (green) cloud. When the faster EMA drops below the slower EMA, the cloud flips bearish (red).
In the SPY example above, the 20 EMA is above the 50 EMA, creating a green cloud. As price pulls back into the cloud,
many traders treat it like a dynamic support zone—a place where price may bounce and continue the trend.
If this concept feels familiar, that’s because it overlaps with the logic behind the
Ichimoku Cloud System:
a shaded zone that helps visualize trend and likely support/resistance.
Best EMA Cloud Settings
Common EMA Cloud settings include 5–12, 8–9, 20–22, and 34–50.
The first number is the faster EMA, and the second number is the slower EMA. The shaded region between them becomes the cloud.
According to Ripster, popular combinations include:
- 5–12 or 5–13 for a fluid trendline (often used for day trades)
- 8–9 to help identify pullback/bounce areas
- 34–50 as a higher-timeframe trend filter (bullish above / bearish below)
Below is an example where the 34 EMA is below the 50 EMA (34–50 setting). The cloud turns red and starts acting as resistance.
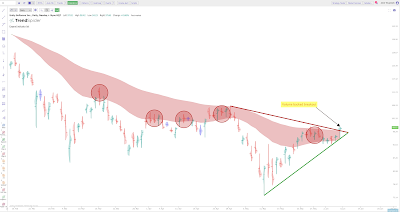
Many traders layer multiple clouds: 34/50 as the long-term trend filter, plus faster clouds for pullbacks, adds, and exits.
This creates the “rainbow” cloud effect shown below.

Step-by-Step Guide on Using the EMA Cloud
- Find the indicator on your preferred platform such as TrendSpider (exclusive discount code available via the link). As new as this indicator is, it’s only available on a few platforms—currently TrendSpider and TradingView.
- Add your preferred moving average type (commonly the exponential moving average). Use one longer-term set (e.g., 34–50) and one shorter-term set (e.g., 8–9).
- Much like Ichimoku, you can shift the cloud forward/backward using an Offset. Offset 0 keeps it aligned to current price; higher values push it forward. Test this—offset can improve visuals, but can also create false confidence if you don’t validate it with real results.
Backtest EMA Clouds (Instead of Guessing)
EMA Cloud settings can work great in trending markets, but the best combo changes by
ticker, timeframe, and volatility regime.
The fastest way to improve results is to backtest and scan setups consistently.
- Backtest EMA Cloud settings across markets/timeframes
- Use automated scanning to find strong trends faster
- Confirm entries with multi-timeframe analysis
- Reduce whipsaws by filtering out sideways chop
Disclosure: This is an affiliate link. If you use it, I may earn a commission at no extra cost to you.
Chart Interpretation
Bullish: When the short-period EMA crosses above the long-period EMA, the cloud turns green.
Bearish: When the short-period EMA falls below the long-period EMA, the cloud turns red.
Bearish: When the short-period EMA falls below the long-period EMA, the cloud turns red.
Pay attention to inflection points where the cloud flips colors—these can act like trend confirmation signals.
But avoid getting chopped up: use settings that don’t flip too easily in sideways markets.
Examples
Here is another example showing how SPY repeatedly reacts to the EMA Cloud over time (daily chart, 20/50 EMAs):

Below is an annotated example from Ripster using a 1-minute AAPL chart and the 34/50 EMA cloud:

EMA Cloud FAQ
Is the EMA Cloud good for day trading?
It can be, especially in trending sessions. For choppy markets, consider stricter filters (higher timeframe trend, fewer flips, or confirmation).
What timeframe works best?
There is no universal “best.” Many traders use a higher timeframe (daily/4H) for trend bias and a lower timeframe for entries.
What are the best EMA Cloud settings?
Common sets include 5–12, 8–9, 20–22, and 34–50. The best settings depend on the market, timeframe, and volatility.
Is EMA Cloud the same as Ichimoku?
No. They share a “cloud” concept visually, but Ichimoku has multiple components and different logic. EMA Cloud is simply two EMAs with shading.
Next Reads (Build Your Edge)
Conclusion
The EMA Cloud is a rare “simple innovation” that improves how traders visualize trend and pullbacks using EMAs.
The real key is to backtest settings on your markets/timeframes and learn when it works (trends) versus when it fails (chop).
If you want a faster workflow to test EMA Clouds and scan for strong trends, use:
TrendSpider
(exclusive discount code via the link).