

Raindrop charts are designed to represent what is happening in the market regarding price and volume. The chart gives the trader a visual representation of supply and demand in the market over a certain time frame. The raindrop charts incorporate volume directly into every price bar through histograms, and the volume of the weighted average price is called VWAP. Hence, Raindrops are a visual culmination of where the price moved, how much time it took to get there, and the flow of the volume as time passed.
Raindrops are meant to replace/supplement traditional charts such as:
- Renko
- Heiken Ashi
- Hollow candlesticks
- Japanese candlesticks
You can see a breakdown of RainDrops below.

Each raindrop is divided into two trading periods: the first and the second trading period. As in the US, the trading of equities is 6 1/2 hrs, each half will be 3 1/4 hrs, and for cryptocurrencies that trade for 24 hours, it will be 12 hours a half. Another difference between the traditional candlestick and the raindrop charts is that the raindrops do not use opening and closing prices but rather use VWAP. This is because the developers believe that using opening and closing prices doesn’t show the price action during a particular time, but only what the price of the stock was at that time.
The raindrops are color-coded into three colors: red, blue, and green. If the right VWAP of the trading period is lower than the left VWAP, the raindrop will be red, and if vice versa, the VWAP will be green; and if the VWAP is at the same level, the raindrops will be blue. The blob shapes in the raindrops represent the complete volume profile for that half of the period. This shows how volume moved during a complete half. A green raindrop is a bullish one, while a red raindrop is bearish, and a blue one shows indecisiveness.
Blue raindrops are constantly used to mark the top and bottom of a trading period. If an asset is highly liquid, buying and selling will not be the same throughout the day; hence, this is an indication of a change in price movement. Keep in mind that blue raindrops that require both halves to have the same VWAP are extremely rare!
To summarize, RainDrop charts do not show the closing price, but rather show price action throughout the day, based on two halves. Each one of these halves has a blob that indicates the volume that was traded around that price. Red, Green, and Blue RainDrops indicate whether the right side VWAP (2nd half of trading) closed lower, higher, or equal to, respectively. Simply put, RainDrops shows you the price range as well as the volume traded at that price through the time period you are focused on!
Why Use Raindrop Charts?
- Raindrops aid in identifying breakouts and fakeouts. A move in either direction should be supported by volume. If a chart looks like it's breaking out, you can always double-check what the volume is saying. As such, it's best to confirm with Raindrops charts as they will be able to say if volume may not be supporting such a move, as such, they are great at detecting fakeouts
. - Raindrops aid in locating market indecision areas- A Blue Doji shows that the market is trying to determine the direction to move. It may also represent a change of a negative or positive move (basically foreshadowing a reversal).
- Volume inclusivity - The volume in trade will help you in weighing the strength; this is a major merit of the raindrop charts. It helps visualize whether any move is backed by volume.
- Utilization of special raindrop patterns- Strong moves are represented by balloon-shaped raindrops, which show that the volume has congregated at an extreme position. Keep note of this last point, as raindrop patterns can emerge. Spending countless hours backtesting and analyzing raindrop charts will help you identify such patterns and increase your profitability in the market.
Examples Of Raindrops Charts
In this section, I will be using many examples provided by TrendSpider's Twitter account. If you are interested in using their service as they are the creators of Raindrop charts, use my affiliate link: TrendSpider (for up to 40% off), using the link provided. Consider using the "Enhanced" package provided by TrendSpider, as it gives weekly one-on-one training by their customer training team.
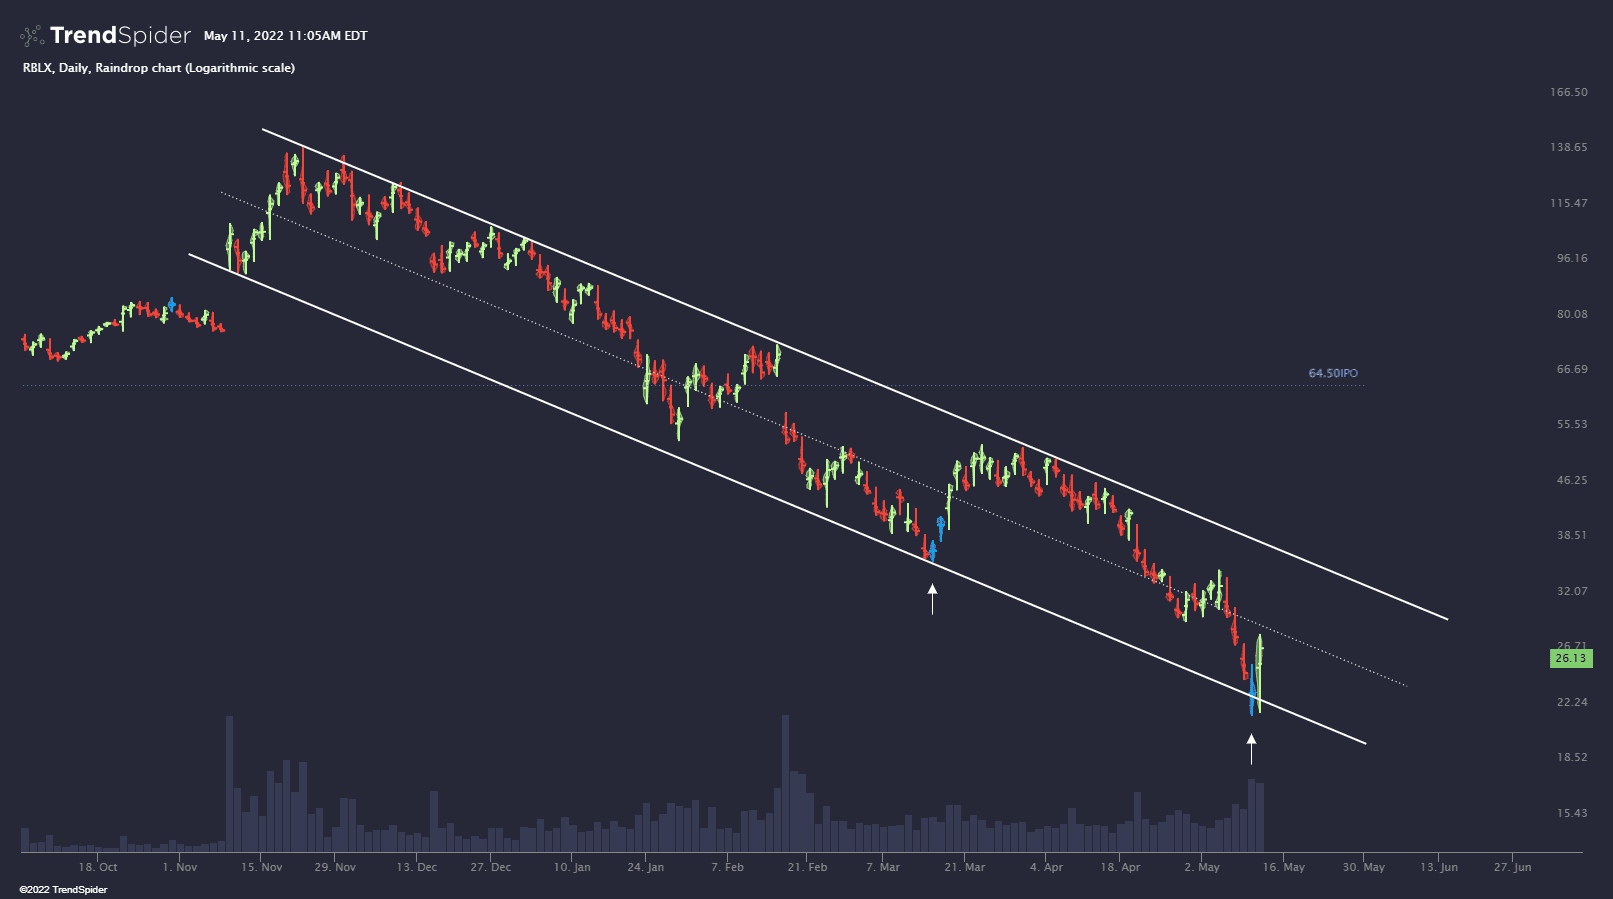
The stock below is Roblox. Notice in the channel that each time a blue Doji (which represents indecision) was encountered, the price bounced hard!
The stock below is the Apple Raindrop ($AAPL) stock chart. In this real-life chart, note that after incurring two daily red raindrops, a blue indecisive raindrop shows up, which represents indecisiveness. The next day, after the blue raindrop showed up, the price bounced!


There are many ways to use Raindrop charts. I gave a few examples, and I left it up to the reader to continue their research and use them in practice and in real time to learn the advantages and disadvantages that they have.
Conclusion
The use of raindrop charts helps you see what other traders do not, giving you an edge. The inclusion of volume in the candles and the use of VWAP aid in identifying the strength of trade. Add this tool to your arsenal of trading indicators and back-test it to know when it gives a high winning rate.
For those interested in incorporating RainDrops, check out TrendSpider (for up to 40% off) using the link provided. Please consider the enhanced package as it provides excellent one-on-one training, weekly!
Want to learn more about RainDrops? Check out TrendSpider's Whitepaper on Raindrops!
For more next-generation indicators, check out my article on the EMA Cloud. Or if you are interested in building your own stock trading system check out this detailed guide.